How many runs per innings did the Celtic Tiger score?
As we announced last week here, Cricket Leinster has digitised the results and team scores of every "senior" match going back the first season of the Senior League in 1919.
From Leinster's 537/7 against Dublin University in June 1957, to Clontarf's 12 all out against Phoenix in May 1936, the wealth of data has given the province's cricketing statisticians a massive opportunity to study many aspects of how scoring has changed over the last century of cricket.
The standard form of analysis when looking at team totals is to look at the first innings only. There is a strong correlation between the score in the second innings of a match and the score in the first innings, as well as many factors (such as rain or a small all out total in the first innings) that would lead to a second innings score corrupting the data.
This analysis has looked at a three year rolling average of 1st innings in ever senior match, where there was some play in the second innings. This means that matches where rain forced an early abandonment of have been removed, but where that abandonment came in the second innings, the total has been kept.
We have also included the 113 two innings matches that took place between 1919 and 1964 (4.2% of all matches in that period). Although the average 1st innings score in those matches was some 40 runs higher than the average in one innings matches (197 against 157), they were an intrinsic part of cricket in Leinster in the first half of the 20th century, and due to the small number of matches played, no allowance has been made for the extra runs scored in those matches. For example the most the inclusion of two innings matches would over-inflate the overall average was by six runs in 1919-1921, and in 1926-1928 the first innings scores in one innings matches were actually two runs more than in two innings matches!

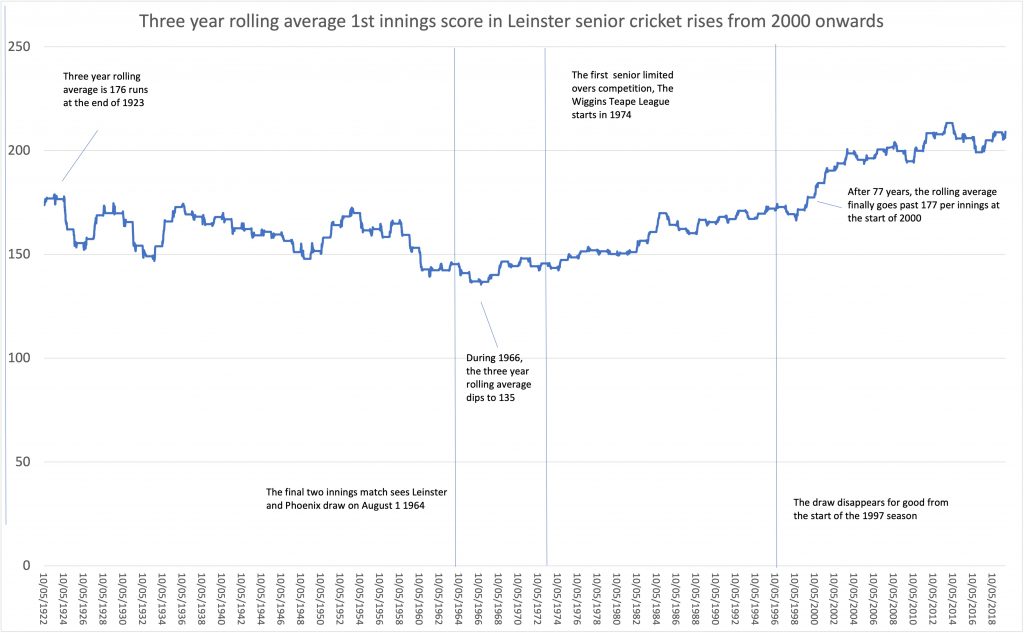
The chart above illustrates several key phases in the history of run scoring in Leinster
- The initial average total of 176 in 1919-1921 settles down, albeit with regular peaks and troughs over the first 40 years. Frequent changes in the structure of the league; and of the teams playing; and the grounds being used, meant that there was a large amount of fluctuation in the average 1st innings score. The final two innings match in the province takes place between Leinster and Phoenix on August 1 1964, and the average continues to fall, reaching an all time low of 135 in August 1966.
- With low and slow scoring remaining the norm, the winds of change start blowing through Leinster cricket, and following developments across the world, a limited overs senior competition starts in 1974, the 45 over Wiggins Teape League. By the end of 1977, the average had risen to 151.
- The scoring rate continued to move upwards throughout the 70s, 80s and 90s reaching 172 when the draw disappears from Leinster cricket at the end of 1996. And finally, the average first innings score passes the 172 mark set in 1921, going past it at the start of 2000
From this 1995 point on, the scoring rates in Senior Cricket continue to increase quickly and have been between 205 and 210 per innings for much of the last decade.
But why was there such an increase from the mid 1970s onwards? There were three components to this rise.
A. Across the world, scoring rates increased from the early 1970s, as the standard of equipment and the standard of pitches improved, along with the "culture" of run scoring. One day cricket slowly engendered a change of attitude across the cricketing world, and not-surprisingly, this affected cricket in Leinster as well.

This Australian blogger has looked at the evolution of ODI team totals in international cricket, and the above chart shows how the pattern observed in Leinster cricket does follow international cricket, namely a slow increase gaining speed in the mid 1990s.
B. But there are two more factors that are specific to Leinster cricket. Along with a general improvement of the standard of pitches in Leinster, Rush's ground at Kenure (regularly from 1995) and North County's ground at Inch (from 2001) are both high scoring grounds that caused the average to improve. How the quality of grounds has affected scoring rates, will be looked at in a future article
C. The influx of new players from around the world undoubtedly had an impact on the quality of cricket in the province. Ger Siggins article in the recent 2021 Cricket Leinster report looks in detail at the impact of overseas players from the 1970s onwards. Undoubtedly, easier movement around the world, and increased migration into Ireland, had an impact on the standard of cricket, although as we will see in subsequent articles, this also saw wide swings in the fortune of clubs. It became common for clubs to have an influx of players one year, and an exodus the following, with the run scoring exploits of the team following a similar pattern.
Over the following series of articles, we will dig deeper into clubs and grounds. We will look at how the fortunes of clubs can change over time, and how best we can measure it.
As a taster, here is a look at Merrion. They serve as a good example, in that they have been playing since the 1920's, and like most clubs, although there have been plenty of highs, there have also been plenty of lows!
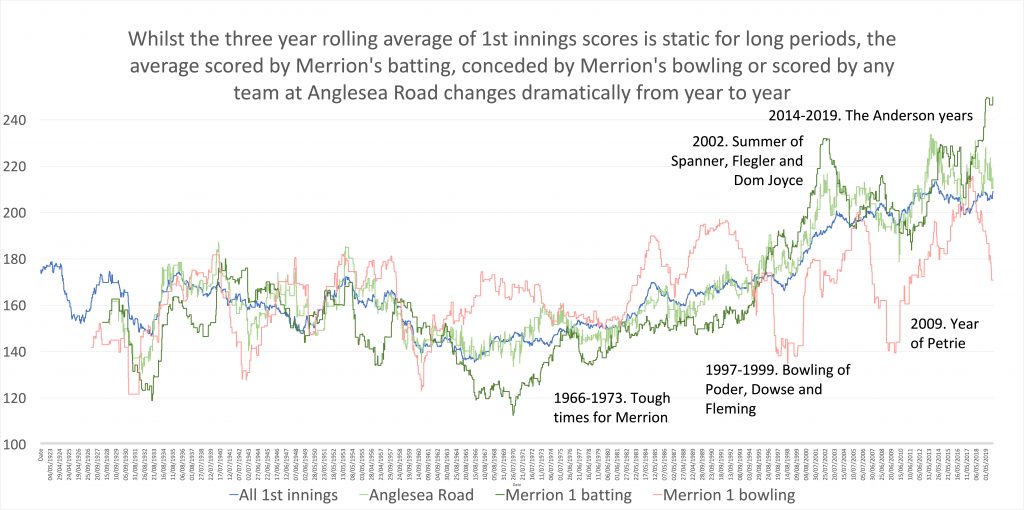
We can divide each club up in three ways. We can look at their three year rolling average for 1st innings when they bat. We can look at the same measure when they bowl. And we can also look at matches that are played in their home ground of Anglesea Road.

Whilst the chart above is something of a jumble of lines, the ups and downs of Merrion's history can be clearly seen. The blue line is the progression we have already looked at - the three year rolling average of all 1st innings in the province in senior cricket. The red line shows the average 1st innings score when Merrion are bowling (with the troughs showing strong Merrion bowling teams). The dark green line shows the varying fortunes of the Merrion batting, whilst the light green line shows the average in Anglesea Road, enabling us to perhaps see the changing qualities of the pitches and outfield.
Several major points of Merrion's history can be clearly seen. Merrion's struggles in the 1960s and 1970s are shown with a batting team unable to get runs, and a bowling attack that conceded too many.
Two deep red depressions show brilliant Merrion bowling attacks - 1997-1999 with Richard Dowse, Damian Poder, Joe Morrissey and Gus Fleming tormenting Merrion's opposition. Australian Matt Petrie led the 2009 attack which is another stand out era for the Anglesea Road club.
And since the turn of the century, there have been several strong run scoring sides, with the 2002 team of Spanner, Flegler and Gus and Dom Joyce and the John Anderson inspired teams of the last decade standing out.
And whilst the data does give us the opportunity to drill down into the history of clubs, it also has its faults. As we have seen, the general scoring rate has been rising since 2000, so that should be taken into account when looking at how Merrion's batting and bowling has fared in the same period.
And although it may look as if rising scores in Anglesea Road mean the pitches are more conducive to run scoring, is that really the reason, or is it that there are better batsmen playing in Merrion?
The next article will look at measures to see how good teams really are, as well as looking at the Celtic Tiger may have improved the standard of cricket in Leinster, but it also widened the gap between the best and the worst.
- IBI CORPORATE FINANCE PREMIER LEAGUE – WEEK ONE PREVIEW (APRIL 26TH)
- VITALLITY SPORTS FIRST TEAM LEAGUE PREVIEW – MATCH DAY 1 (27.4.2025)
- SENIOR CAREER FIELDING RECORDS (APRIL 2025)
- LEINSTER SENIOR CRICKET: ALL ROUNDER MILESTONES
- SENIOR CAREER BOWLING AVERAGES
- SHERWIN O’RIORDAN LEINSTER LIGHTNING SQUAD 2025 CONFIRMED